Install the EduFrame Power BI Connector
This is an explanation on how to install and use the custom connector for importing EduFrame data into Power BI on an educator level.
Install requirements
In order to using the custom connector, you need the following:
- A windows operating system
- The custom connector
- The registry file
- Power BI Desktop
- OAuth enabled for PowerBI (Contact support@drieam.com about this.)
Installation steps
- Install Power BI Desktop using the link provided above.
- Navigate to:
C:\Users\<your username>\Documents\Power BI Desktop\Custom Connectors. If this folder does not exist (eitherPower BI DesktoporCustom Connectors), just manually create the folder. - Paste
EduFrame.pqxin this folder. - Run
Eduframe.regand add the registry value (to add our connector as a trusted source).- Only needed once. For future updates you can skip this step.
- Restart the Power BI Desktop client if you have the application open.
Now we are ready to use the connector.
Usage
After following the installation steps, you can find the connector in the list of connectors in Power BI Desktop. First, we need to change the security settings to allow for third-party connectors like the one for EduFrame.
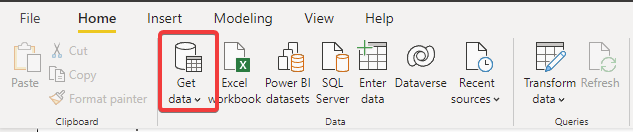
- Open Power BI Desktop.
-
Click Get data.
-
Find the EduFrame Connector in the list.
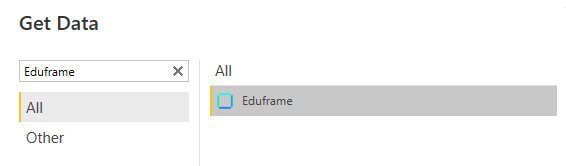
and press Connect.
-
Get your site-url ready, as you have to provide it in the next screen.
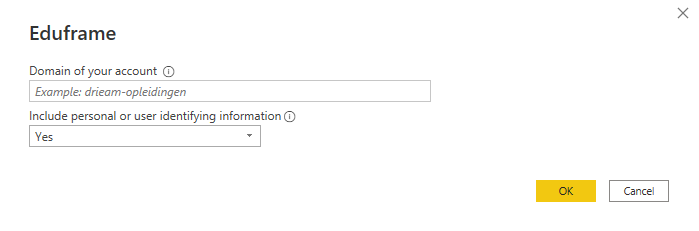
Enter the Domain in the
Domain of your accountfield. With https://drieam-test.eduframe.nl this will bedrieam-test.The
Include personal or user identifying informationcan be set to eitherYesorNodepending on your choice. More details about including or excluding personal information can be found here -
Press the
Sign inbutton to start the authentication with Eduframe.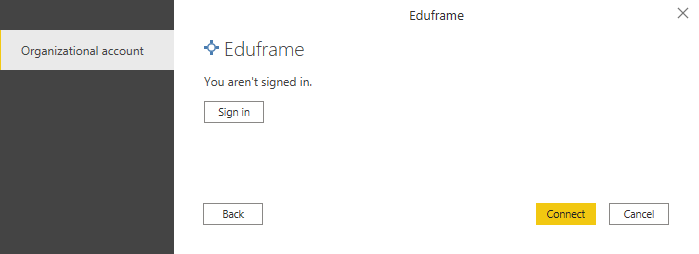
-
Login with your credentials and press
approvewhen asked for the Eduframe data permissions.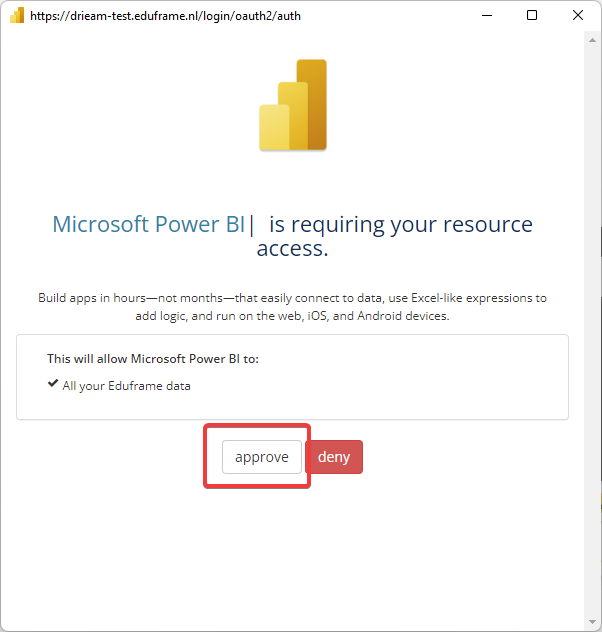
Press
Connectto complete this step. -
You will now be prompted with the Navigator. It’s possible to expand the folders to see all the listed tables.
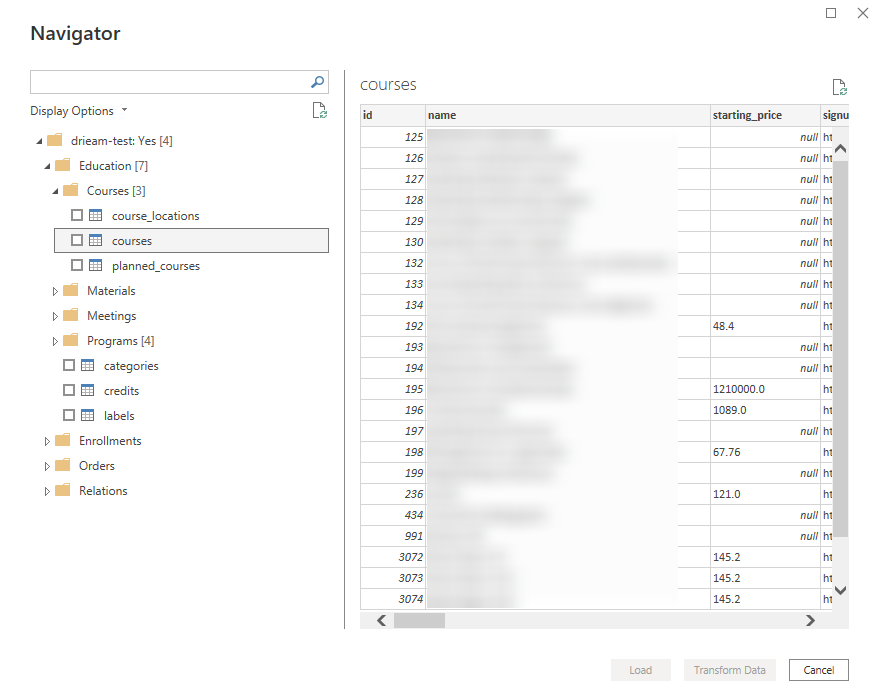
This window shows all the tables that you can import. Select the desired tables and press Load.
You are now ready to use the imported data to build reports in Power BI! If needed, you can use one of our templates here
Available data
Currently, the available data can be found here.
Connecting Tables in Power BI
The following steps might be unnecessary when using one of our templates.
In order to combine the imported data in Power BI, we must define all relations in the database. This gives you the ability to create Power BI visualisations combining multiple tables and it gives you the ability to create intricate filters to slice your reports.
Press the following button to enter the table overview window

In this window we can see all the tables that have been imported in the previous sections. You can move tables around and adjust the zoom of the window to increase visibilty and structure.
In the following steps we are going to create the following relations:

To create the relation arrow between the tables, as seen in the image below, we simply hold and drag the field course_id to id and let go.

We need to do this for the following relations:
- drag courses.category_id onto categories.id
- drag planned_courses.course_id onto courses.id
- drag orders.planned_course_id onto planned_courses.id
- drag enrollments.order_id onto orders.id
- drag enrollments.student_id onto users.id
- drag orders.account_id onto accounts.id
- drag invoices.account_id onto accounts.id
- drag leads.account_id onto accounts.id
- drag planned_courses.course_location_id onto course_locations.id
After creating these relations, the tables should be connected in the same way as shown in the example image. To check if the relation is connected to the right fields, hover over the arrow line with your mouse and the two connected fields will be highlighted.